911 Calls for Service Analysis
Project Overview
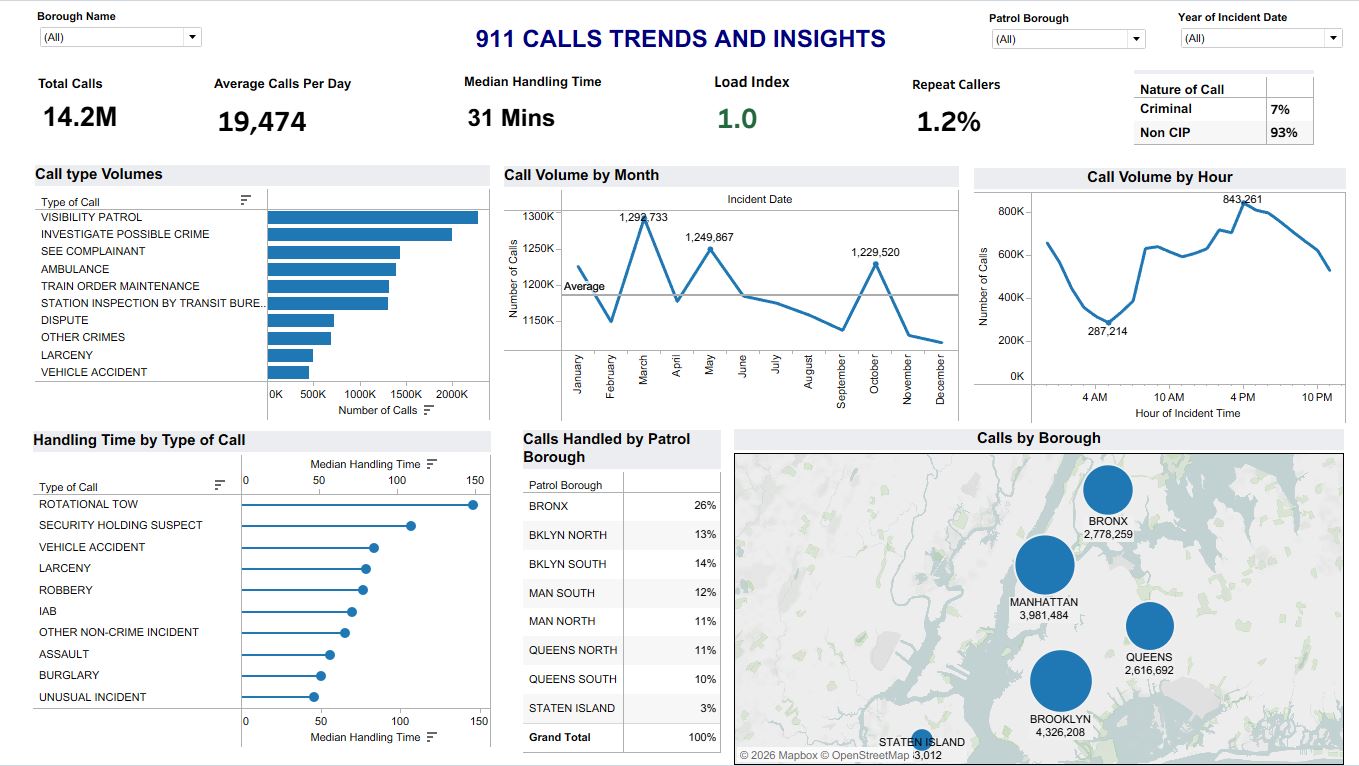
This project analyzes NYPD 911 call data (2023–2024) to support data-driven emergency response planning in New York City. The objective was to understand how different call types, time patterns, and borough-level trends affect NYPD workload, and to identify opportunities for improving response efficiency through smarter staffing and multi-agency coordination.
Using Tableau, we transformed large-scale public safety data into an interactive analytical dashboard that enables stakeholders to monitor workload pressure, identify inefficiencies, and evaluate policy-level interventions for emergency response and budgeting decisions.
Key Features
Interactive Tableau Dashboard
Designed a fully interactive Tableau dashboard with KPIs including Load Index, Handling Time, Call Volume, and Repeat Caller Rate, enabling rapid exploration by borough, time, and call type.
Workload & Resource Analysis
Analyzed borough-level workload imbalances, highlighting areas with the highest operational strain and longest call handling times to support data-driven staffing decisions.
Time-Based & Seasonal Insights
Identified hourly, daily, and seasonal call patterns, allowing predictive staffing strategies and proactive resource allocation.
Policy-Oriented Recommendations
Delivered actionable insights to reduce non-criminal call burden on police by recommending call diversion to EMS, social services, and community responders, and optimizing processes for high-duration call types.